|
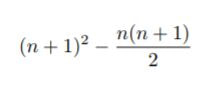
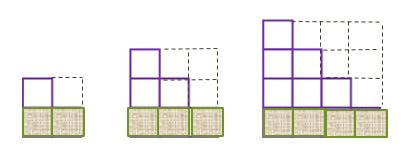
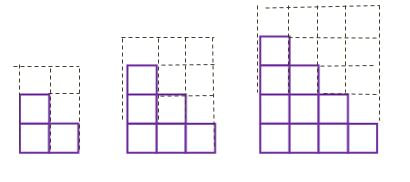
This summer I enrolled in a course called, "How to Learn Math for Teachers," taught by Professor Jo Boaler, a Professor of Mathematics Education at Standford University. The course brings together best practices from research on brain growth and classroom techniques for anyone who's curious about engaging students in mathematics education. One of the course modules talks about creating or giving students tasks with a growth mindset framework, which has the following components: 1. Openness 2. Different ways of seeing 3. Multiple entry points 4. Multiple paths/strategies 5. Clear learning goals and opportunities for feedback The example that is given from the course is as follows: 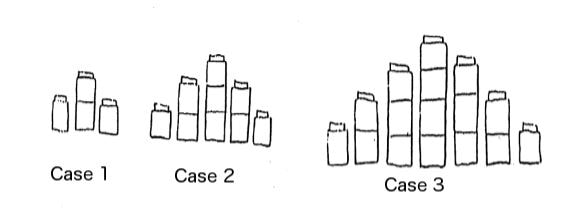 Without any numbers or formulas, describe how you see this shape growing. A teacher might ask, "There are more squares in case 2 than in 1, where are they? There are more squares in case 3 than in 2, where are they? Describe what you see." Go ahead and try this task on your own first. Watch the video to see examples of different responses (skip to 3:50). This type of task is referred to as a "low entry, high ceiling" task, as anyone, regardless of their skill level can engage with the question, "How do you SEE this pattern growing?" and the question can be extended to higher levels. youcubed.org has tons of videos, teaching resources, and research papers that challenge the status quo on what it means to be "mathematically minded". Check them out! I decided to try a similar task with my Pre-Calculus students in China, and picked a pattern from Fawn Nyugen's site visualpatterns.org 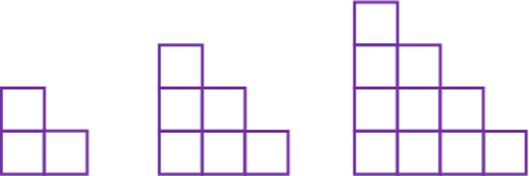 Based on my students with Chinese students thus far, many of them are quite baffled whenever they get an open task like this. They are used to the typical, "how many squares are in the next case? The 100th case? The nth case?" type questions and so my challenge was really to get them to train their brains to operate different ways with respect to math. This took time. Two classes in fact, but it was worthwhile. Here are some answers that students came up with (I posted 6 copies of the same image and challenged my classes to fill all 6 with different representations). 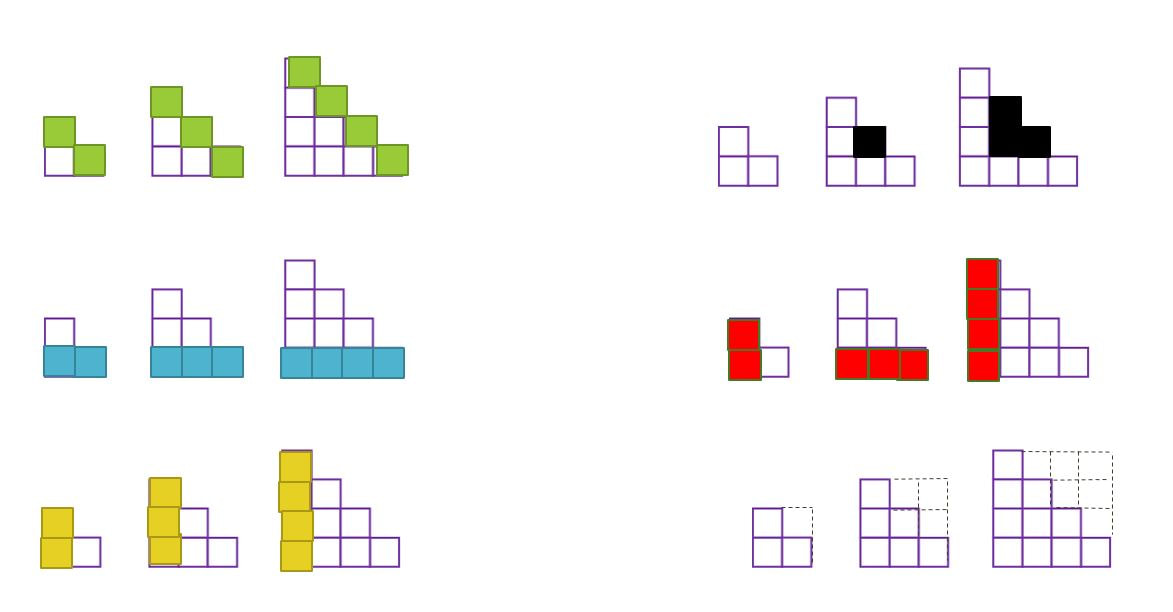 (From top to bottom, left to right) 1. "Raindrop" method. Squares fill in from the top. 2. "Bowling Alley". Squares being pushed up from bottom. 3. Squares pushed in from the left. 4. L-shape 5. Rotating Left/Bottom 6. "Negative Space" the missing squares form the same number of squares as the previous case. After, and only after students have had a chance to visualize the problem, and see other representations of the same pattern in multiple ways did I have them attempt to come up with a formula for the n-th term. Most students were able to set up a table and saw that the difference from one case to the next increased by 1 each time: 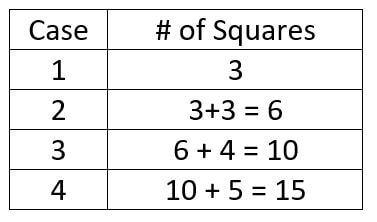 But only a few students were able to break it down further. A message I kept telling my students, "If you're going to fail, fail differently each time!" 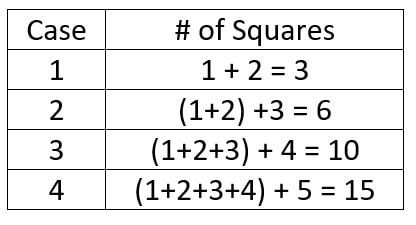 It turns out that most of these students had been exposed to Gauss' summation before. Those that did were able to find a formula for 1 + 2 + ... + n, but the challenge with this pattern is that we start at 3. Another student used the "square" representation as a part of his proof but isolated the last row. Looking at the diagram below, we see that the total number of squares can be represented by (n+1)^2. Ignoring the last row, we see that the number of actual squares and "negative space" squares are equal. The total number of squares (excluding the bottom row) is therefore given by [(n)(n+1)]/2. Putting both these parts together, we get that the total number of squares for case n is:
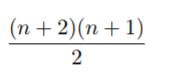
My favorite proof thus far, though, is this one: -Take the square representation, ADD another layer -Now we have a rectangle with equal amounts of actual squares and "negative space" squares -The resulting formula is just the area of the rectangle divided by 2
Even though this material isn't explicitly stated in the curriculum documents for this course, it was a valuable exercise to have done with my students. I had a few students approach me after class, eager to show me their proofs and what they had discovered. Throughout our whole discussion, I never gave students any answers, but focused on process. This is a message I want all students to internalize when they leave my classroom.
0 Comments
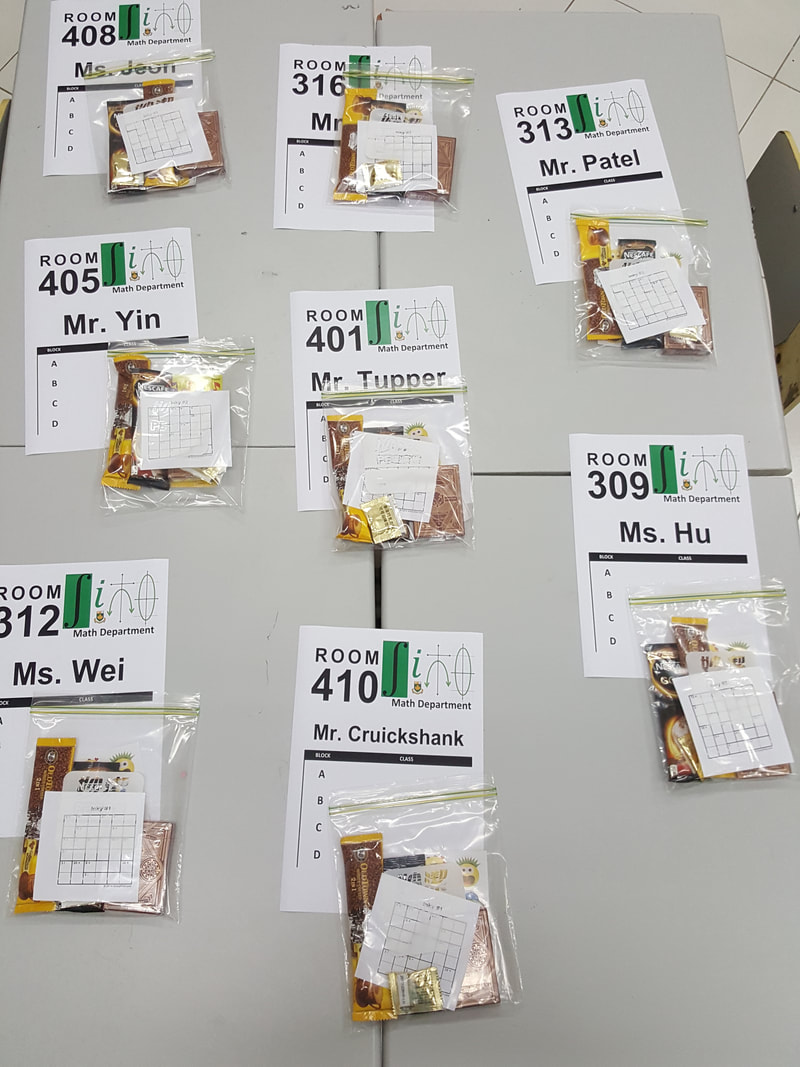
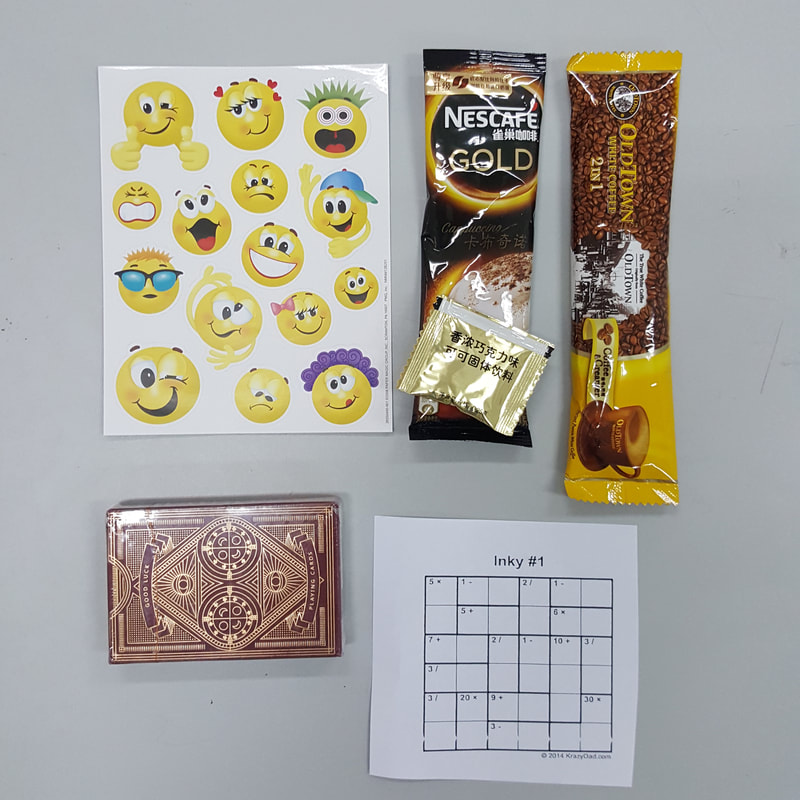
Never in my life did I ever imagine myself teaching in China, and yet, here I am for a second year at that! Below are images of welcome packages I put together for the members in the Math Department this year, which includes: - A door sign with the teacher's name, room number, and teaching schedule -Stickers, 'cuz duh -Coffee, a key element in sustaining the life force of a teacher -A pack of cards, essential in any math teacher starter kit -A math puzzle, fuel for the brain I'm super happy with the way they turned out, and I'm looking forward to a good year ahead!
This year I'll be teaching Pre-Calculus 11 and Calculus 12, which I'm both excited and nervous about! It's been years since I've taken Calculus and this will be my first year working with twelfth grade students (I've been doing a lot of review this summer on Khan Academy). Here's a fun activity that I found on Kate Owen's blog that I plan on using this week with my Calculus 12 students. It's a great way to review concepts and vocabulary from Pre-Calculus to see what students already know and remember from the course. I've added some modifications and created an accompanying PPT that's a full lesson, all ready to go. Scroll down below to access this resource :) I'm a big believer in sharing teaching resources for free, and this is my way of giving back to the online teaching community that has given so much to me. Huge shout out to everyone in the #MTBoS, I love this community. The activity works as follows: 1.Students it with a partner, shoulder to shoulder. 2.One person faces the board, the other person faces away. 3.The person facing the board will be the explainer. 4.The person facing away will be the grapher. Warm Up: Teacher does warm up round with the students, describing a basic graph (ex. linear function) and students attempt to draw it in their notebooks. Discuss: What prompts were useful? Is there something the teacher said that could have made it easier? The Activity: (see above) Exit Ticket: Given a picture of a graph, students are to write a description that matches it in as much detail as possible. Extension: Students draw a graph and write a corresponding description. Scramble the results and have students match them!
|

April SooInternational math educator who writes, occasionally. Archives
April 2020
Categories
All
|
||||||||
 RSS Feed
