|
Teachers are getting a bad rap these days. To put it in perspective, my own mother -- to whom I am and shall always remain eternally grateful for -- expressed her annoyance at the fact that Ontario teachers were, yet again, going on strike. (I will also add here that she is also very supportive of the fact that her own daughter chose teaching as a profession). Like others, she felt that the strikes are an unnecessary waste of time, making teachers appear selfish and lazy. When asked what information she had to support her claim, the figure "100K" came up in conversation. WHAT? How much are teachers making a year? $100 000. One hundred THOUSAND Canadian dollars. The supposed "average" salary Ontario teachers make a year. Reported source? "The government."  Had it not been for the fact that a) my mother has a tendency to exaggerate the truth and b) I am a teacher myself, I may have been inclined to side with her claim. To add a bit of context: I have been teaching for five years internationally and making nowhere near that figure. For me to be earning 100K a year, I would need to have my masters degree and an additional fifteen years of full time experience. Let's Talk About Averages "Average" is a misleading term; it can refer to the mean, median or mode. In statistics, we call these "measures of central tendency." Let me borrow an example from Wheelan's book (Naked Statistics) to make a point. Suppose five people are at a bar, each earning a salary of $35k a year. Undisputedly, the average salary (by all counts) of the group would be $35k. Typically, when we hear the word average, we equate it with the mean, which is the sum of all the points in a data set, and divided by the total number of values within the set. Suppose Bill Gates walks into the bar, with a salary of $1 billion a year, bringing the average (mean) salary to $160 million. The reported figure, while still accurate, is not a fair representation of the average earnings of the majority of individuals in the group. 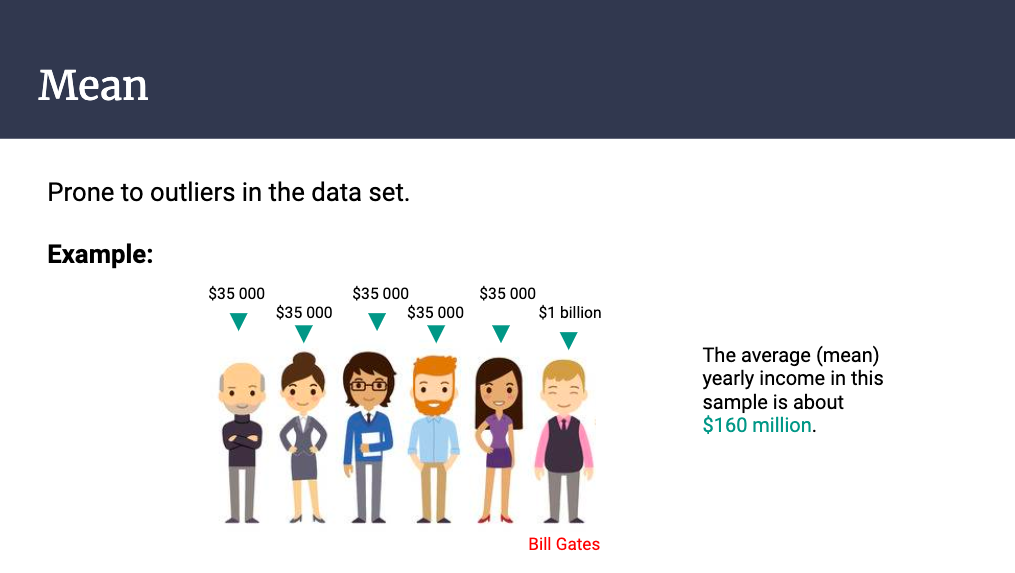 In this case, the knowing the median (middle value when all values are arranged from smallest to greatest) provides a bit of context. After all, the difference between 35 thousand and 160 million is no small sum. 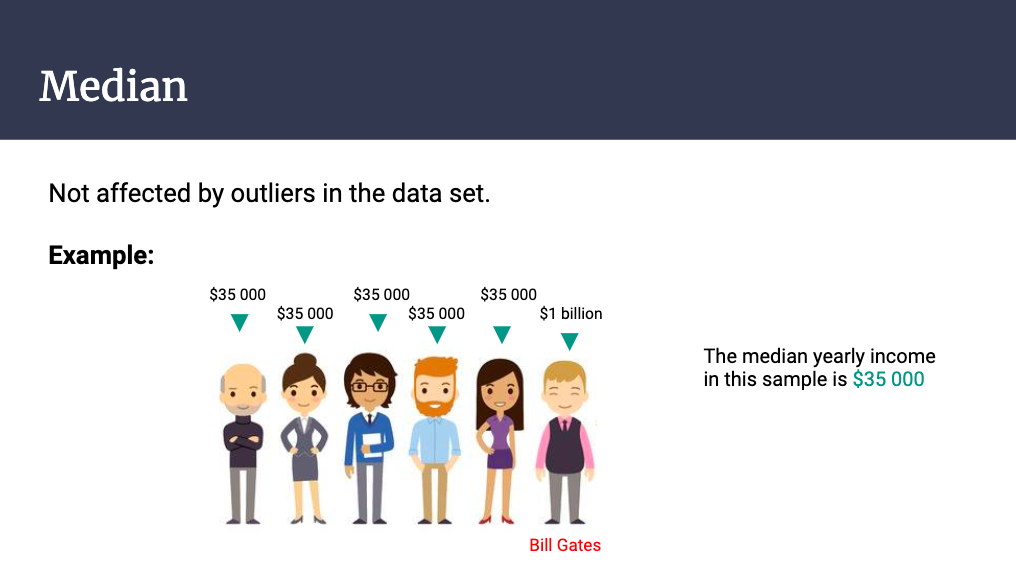 This is a classic example of how precision can mask accuracy. Think about any time you've heard a number or figure reported in the news, consider the following statements, for instance: Statement 1: "99% of statistics are made up" (Ha!) Statement 2: "I have here in my hand a list of 205 -- a list of names that were made known to the Secretary of State as being members of the Communist Party and who nevertheless are still working and shaping policy in the State Department" - Joseph McCarthy, a US previous senator (1950) Don't these it seem to bring credibility to whatever claim the person or organization is trying to assert? The first statement is, of course, made up. As for the second statement, it turns out that the paper had no names on it at all. Statistics is a tool that helps us bring meaning to data, but can be abused for nefarious purposes if wielded irresponsibly. 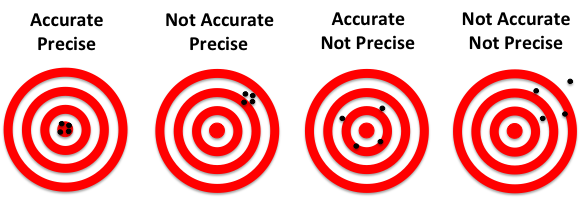 https://www.dnasoftware.com/our-products/copycount-qpcr-analysis-copynumber/precision-and-accuracy/ We should be cautious While math may be infallible, we are not. No matter how convincing the data may be, there is always more than one way to interpret it. It's a little like telling your friends and family that the guy you just met "has a great personality," which almost always implies that there is some other flaw or red flag that has not been said (Wheelan 37). So, back to the this 100k salary I'm supposed to be making... How did they get this data? What are the demographics of the teachers being surveyed? (It makes a difference if the majority of teachers who have been working full time in Ontario have at least 15 years of experience under their belt). Are they including retired teachers? Teachers who have recently been laid off? I tried to trace the origins of where this figure of 100k came from. After a bit of digging, I think its likely that my mother mis-reported the figure she heard from sources that gave out misinformation. 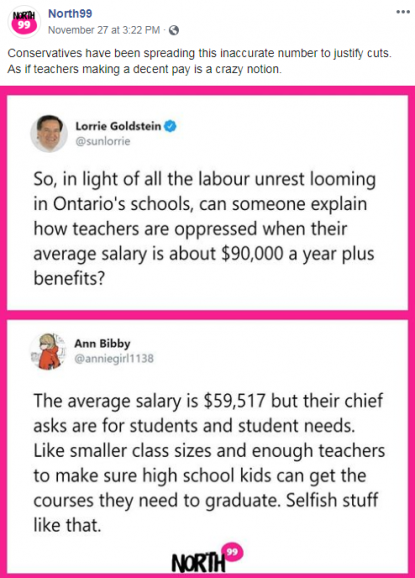 [NOTE FROM THE AUTHOR: I purchased Naked Statistics by Charles Wheelan many years ago, thinking its an important book to add to any Math Teacher’s arsenal (and it is!) but had only gotten through the first three chapters before dismissing it for another read. It is not a boring book - quite the opposite in fact - but I felt that mere passive reading was not enough for me to really retain the important ideas and intuition that Wheelan is trying to impart to his readers. This time, I’m giving it another chance and plan to summarize material I am learning, relate it to my own experiences, and share that learning here on my blog.]
0 Comments
Leave a Reply. |

April SooInternational math educator who writes, occasionally. Archives
April 2020
Categories
All
|
 RSS Feed
